Graphing√ x
We know from the last page how to find the domain and range of a function.
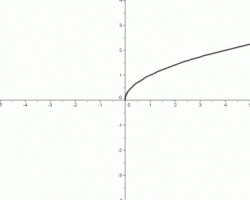
Graphing the simplest radical function, f(x)=√ x, is almost as simple as finding the domain and range.
The domain and range are easy to find for this function.
Since x is the only thing inside the radical, x itself must be greater than or equal to zero.
Plugging in this domain into the function, f(x) will also have all the values greater than or equal to zero.
This means that the graph will lie only in the first quadrant, since neither x nor y can be negative.
After plugging in the first few known points an easy pattern starts to emerge.
(0,0), (1,1), (4,2), (9,3). Both the x's and y's are increasing, but the x's are increasing faster and at an increasing rate.
From this we can infer that the slope of the line is decreasing, and fitting the line through our first known points results in a graph that looks like this:
Source: http://www.onemathematicalcat.org/Math/Algebra_II_obj/Graphics/fct_sqrt.gif
We already know from our domain and range that the line will increase forever in both the x and y directions, so there are no asymptotes.
This basic curve is the starting point for graphing all square root functions.
We already know from our domain and range that the line will increase forever in both the x and y directions, so there are no asymptotes.
This basic curve is the starting point for graphing all square root functions.

